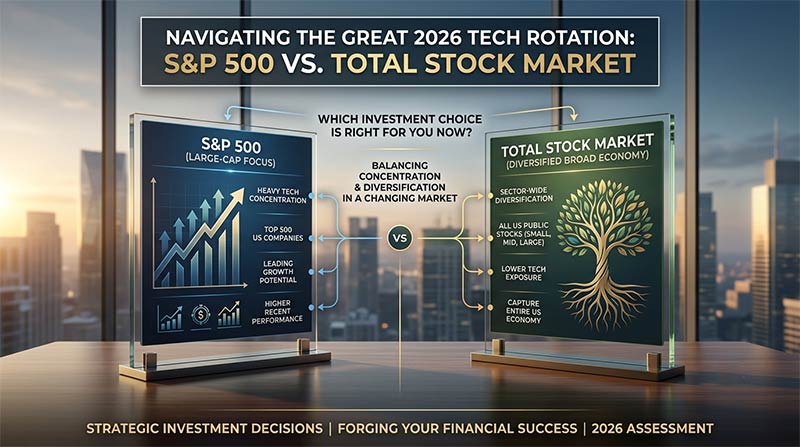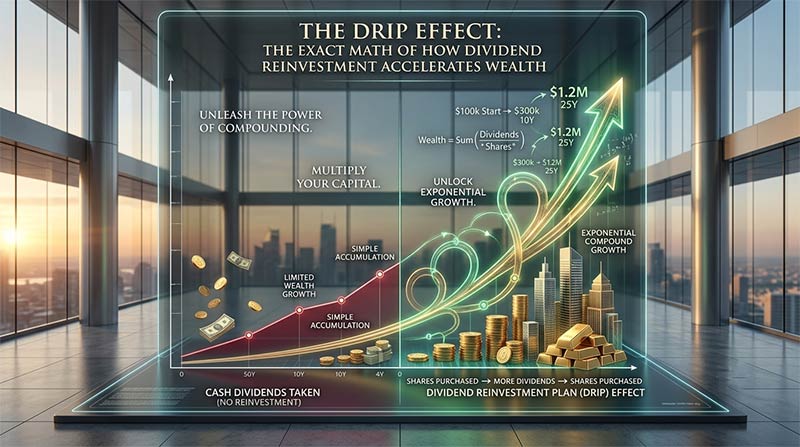
When you track a stock’s performance, it’s easy to get fixated on the daily price chart. If an index or stock climbs from $100 to $105, it feels like a straightforward 5% win. But optimizing for price movement alone ignores the single most powerful driver of long-term market outperformance: the Dividend Reinvestment Plan (DRIP).
Reinvesting dividends changes the math of your portfolio from linear growth to exponential growth. Instead of taking your quarterly or annual payouts as cash, a DRIP uses those distributions to buy more shares—including fractional shares—of the same asset. Over decades, this creates a loop where your dividends earn dividends of their own.
Here is exactly how the math works out, why it matters, and the hidden mechanics that separate average portfolios from high-performing ones.
The Core Math: A 20-Year Case Study
To see the compounding engine in numbers, let’s isolate the variables. Suppose you invest $10,000 into an equity fund.
To keep the comparison clean, we will project three distinct long-term strategies over a 10- and 20-year horizon based on two steady assumptions:
- An annual stock price appreciation of 5%
- An annual dividend yield of 3%
| Metric / Timeline | Strategy 1: Price Growth Only (No Dividend) | Strategy 2: Price Growth + Cash Dividends (No Reinvestment) | Strategy 3: Dividend Reinvested (DRIP) |
| Initial Investment | $10,000 | $10,000 | $10,000 |
| Year 10 Portfolio Value | $16,289 | $16,289 | $21,589 |
| Year 10 Cumulative Cash | $0 | $3,773 | $0 |
| Year 10 Total Value | $16,289 | $20,062 | $21,589 |
| Year 20 Portfolio Value | $26,533 | $26,533 | $46,610 |
| Year 20 Cumulative Cash | $0 | $9,920 | $0 |
| Year 20 Total Value | $26,533 | $36,453 | $46,610 |
Analyzing the Delta
By Year 20, Strategy 3 (DRIP) outperforms Strategy 2 (Cash Dividends) by $10,157.
Why does this gap exist if both assets yielded the exact same 3% dividend? In Strategy 2, your dividend remains flat relative to the share count; you collect cash based purely on the original 100 shares as they appreciate.
In Strategy 3, your share count expands every single time a dividend is paid. By year 20, you aren’t just earning a 3% yield on your initial principal—you are earning a 3% yield on an ever-growing mountain of fractional and whole shares accumulated along the way. Historical data from Vanguard’s research on distributions consistently demonstrates that over multi-decade periods, reinvested income accounts for a massive portion of total equity returns.
The Hidden Mechanics: Dollar-Cost Averaging via DRIP
Most people view dividend reinvestment purely as a compounding tool, but it also functions as an automated risk-mitigation framework. Because DRIP executions occur on set payment dates regardless of market sentiment, you are inherently practicing dollar-cost averaging.
When the market enters a correction or bear market, the dollar value of your dividend remains tied to the company’s payout metrics, but the stock price drops. Consequently, your dividend distribution automatically buys more shares when prices are depressed. When the market recovers, those extra shares accelerate your portfolio’s rebound.
According to a comprehensive breakdown by Charles Schwab on DRIP mechanics, this process removes the emotional pitfalls of market timing. It turns volatility into a structural advantage by building your share base when equities are on sale.
The Tax and Friction Realities
While the math is compelling, optimizing a portfolio for Google search viability requires addressing the real-world frictions that impact net returns.
1. The Tax Trap in Taxable Accounts
A common misconception is that if you do not touch the cash, you do not owe taxes. In reality, the IRS views a reinvested dividend exactly the same as cash in hand. If you hold a dividend-paying asset inside a standard taxable brokerage account, you will owe ordinary income or qualified dividend taxes on those distributions in the year they are issued.
- The Fix: For maximum mathematical efficiency, route dividend-heavy strategies through tax-advantaged wrappers like a Roth IRA or traditional 401(k), where growth and reinvestments compound tax-free or tax-deferred.
2. Cost Basis Tracking
Every single DRIP execution creates a new “tax lot” with its own unique purchase date and cost basis. If you hold an asset for 20 years and it pays dividends quarterly, you will accumulate 80 distinct tax lots. If your brokerage does not track this automatically, calculating your capital gains upon eventual sale can become highly complex. Modern brokerages handle this automatically, but manually tracking older or direct company-sponsored plans requires rigorous record-keeping.
When Should You Turn DRIP Off?
Automated compounding is optimal for the wealth-accumulation phase of life, but it isn’t a universal default. There are two scenarios where turning off your DRIP makes tactical sense:
- You Require Income Lifestyle Support: If you are transitioning into retirement, changing your brokerage election from “Reinvest” to “Pay out as cash” provides a steady, organic cash flow stream without forcing you to liquidate your underlying shares.
- Portfolio Rebalancing: If one specific stock or sector has grown to dominate your portfolio, continually pumping dividends back into that single asset increases your concentration risk. Taking those dividends as cash allows you to manually allocate capital into underweighted, undervalued areas of your portfolio to maintain your target asset allocation.